Research reports now show key figures and charts
A research note used to be prose with the numbers buried inside it. A drafted note now opens with a row of metric cards and follows with charts, so you can read the figures before you read the argument.
Metric cards
The cards come from the filed tables of the company under review. Each card carries one figure from those tables.
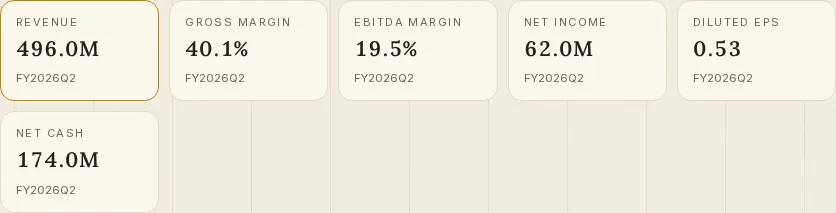
The metric cards at the top of a drafted note. The screenshot shows Korvane Motion Systems (KRVN), a fictional company in our public demo.
Charts
Three charts follow the cards:
- Revenue and operating profit.
- EPS, actual against the consensus estimate.
- EBITDA margin, compared with peers.
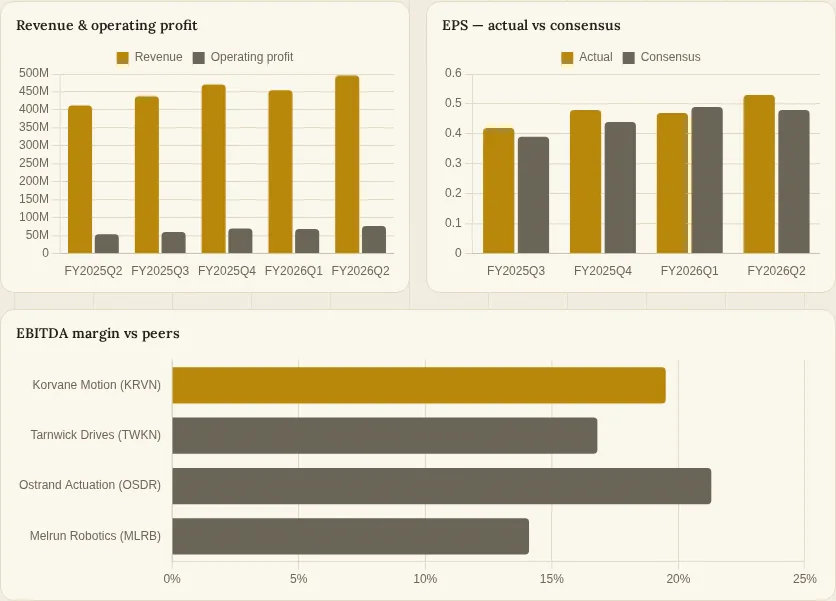
The charts in a drafted note. The screenshot shows Korvane Motion Systems (KRVN), a fictional company in our public demo.
As-of figures
Every figure is point in time. A note drafted for a given date uses the figures filed as of that date, so reading it again later shows the same numbers.
You can open a sample note in the demo.
Not investment advice.