Active, Passive & Bond Strategies
Overview
Investors use different management styles to maintain their investment portfolios. This chapter covers:
- Strategic asset management
- Tactical asset management
- Active portfolio management
- Passive portfolio management
- Bond management, including:
- Bond ladders
- Bond barbells
- Bond bullets
Strategic & tactical asset management
Investment advisers typically use one of two asset management approaches: strategic or tactical.
Definitions
| Term | Definition | Example |
|---|---|---|
| Asset | A type of investment or object of value | Stock, long-term bonds, real estate |
| Asset management | The process of maintaining a suitable mix of asset allocations (percentages) given an investor’s situation | — |
🔑 Strategic vs. tactical asset management
| Strategic asset management | Tactical asset management | |
|---|---|---|
| Definition | Setting a long-term asset allocation based on the investor’s goals, time horizon, and risk tolerance | Temporarily deviating from the long-term strategic allocation |
| Time frame | Long-term / foreseeable future | Short-term |
| Purpose | Maintain a suitable allocation aligned to the investor’s situation | Take advantage of short-term opportunities or reduce short-term risk |
| Maintenance action | Rebalancing back to the target when the portfolio drifts | Shift away, then return to the original strategic allocation |
| Both | Focus on building a suitable asset allocation based on the investor’s situation and goals | Same |
Strategic asset management — worked example
A possible allocation for a 40-year-old investor saving for retirement (a typical allocation for an average 40-year-old; it matches the rule of 100):
| Asset | Allocation |
|---|---|
| Common stock | 60% |
| Preferred stock | 10% |
| Long-term bonds | 25% |
| Money markets | 5% |
A strategic asset allocation is in place if the adviser recommends keeping this structure for the foreseeable future.
Once the investor accepts the recommendation, the adviser adjusts the portfolio to match the target allocation. That may require selling securities the investor already owns. For example, if the investor is currently 100% invested in common stock, 40% would be sold and reallocated to preferred stock, long-term bonds, and money markets.
Drift: Over time, market performance will naturally push the portfolio away from its target. If common stocks outperform fixed income, the common stock percentage rises while the others fall. After several months, the allocation might look like this:
| Asset | Allocation |
|---|---|
| Common stock | 75% |
| Preferred stock | 5% |
| Long term bonds | 17% |
| Money markets | 3% |
When the portfolio drifts too far from the original strategic allocation, the adviser should recommend rebalancing. In this example, 15% of the common stock would be sold, and the proceeds would be invested in preferred stock, long-term bonds, and money markets to move back toward the original target.
Tactical asset management — worked example
Start with the original strategic allocation for the 40-year-old investor:
| Asset | Allocation (strategic) |
|---|---|
| Common stock | 60% |
| Preferred stock | 10% |
| Long term bonds | 25% |
| Money markets | 5% |
If the adviser shifts away from this long-term plan for a short period, that’s tactical asset management. Suppose the adviser expects fixed-income markets to significantly outperform common stocks over the next six months. The adviser might shift the portfolio to:
| Asset | Allocation (tactical) |
|---|---|
| Common stock | 45% |
| Preferred stock | 15% |
| Long term bonds | 35% |
| Money markets | 5% |
The portfolio stays at this tactical allocation for six months because the adviser believes preferred stock and long-term bonds offer better return potential than common stocks during that period. After six months, the adviser sells the “extra” fixed-income positions and reinvests the proceeds into common stock to return to the original strategic allocation.
Active & passive portfolio management
We discussed active and passive management styles in the exchange traded funds (ETFs) chapter. Here’s a refresher, with a focus on how these styles relate to suitability.
🔑 Active vs. passive portfolio management
| Active portfolio management | Passive portfolio management | |
|---|---|---|
| Definition | Selecting individual securities with the goal of “beating the market” (“the market” = the broad market for a given asset class) | Investing in the broad market without trying to identify the best individual securities |
| Approach | The manager looks for the “best” investments — e.g., choosing 50 of the 500 stocks in the S&P 500 in hopes the portfolio outperforms the index | Track an index rather than selecting securities; commonly done via index funds and ETFs |
| Goal vs. benchmark | Outperform the benchmark index (e.g., a large-cap common stock portfolio tries to outperform the S&P 500) | Mirror the index (“indexing”) |
| Track record | An analysis performed in 2019 found only 23% of actively managed funds outperformed their benchmark index over the previous 10-year period | If it’s hard to beat the market consistently, investing in the market itself may be more reliable |
| Costs | Higher — requires ongoing research and trading | Lower |
| Average expense ratio | ~0.65% | ~0.05% |
Definitions
| Term | Definition | Example |
|---|---|---|
| Benchmark index | The comparable index to a specific investment | The S&P 500 is the benchmark index for a large-cap stock fund |
| Indexing | Holding investments that mirror index movements | Index funds, ETFs, and even index options can be used to do this |
Why investors often prefer passive management
- Actively managed portfolios often underperform their benchmark indexes (as shown above). The idea is simple: if it’s hard to beat the market consistently, investing in the market itself may be more reliable.
- Passive management typically costs less. Active management requires ongoing research and trading, which increases costs.
Buying every security in an index (such as all 500 stocks in the S&P 500) is difficult for most investors. That’s why index funds and ETFs exist.
Expense ratio impact — worked example
Expense ratios of passively managed funds are typically significantly lower than those of actively managed funds. The average expense ratio for actively managed funds (~0.65%) is more than ten times that of passively managed funds (~0.05%). While the difference (0.60%) may seem small, it can create a large gap in results over long periods.
Assume an actively managed fund and a passively managed fund both earn a 10% annual return over 30 years, with a $100,000 investment in each:
| Fund | Expense ratio | Total cost over 30 years |
|---|---|---|
| Actively managed | 0.65% | $285,919 |
| Passively managed | 0.05% | $26,174 |
Expense ratios can be easy to overlook because investors don’t pay them directly out of pocket. Instead, the fund deducts expenses from its assets, which reduces the investor’s return. Over long periods, a lower expense ratio can save hundreds of thousands of dollars (and even more for larger positions).
To justify the higher costs of active management, returns must consistently outperform the benchmark.
Bond strategies
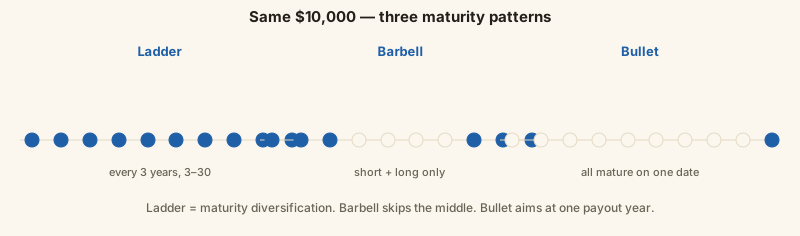
Investors who want bonds as part of a long-term portfolio strategy may use one of several bond approaches. The most popular are:
- Ladders
- Barbells
- Bullets
🔑 Bond strategy comparison
| Strategy | Named after | Structure | Key benefit |
|---|---|---|---|
| Ladder | The rungs of a ladder | Investments spread across many maturity dates, evenly spaced; includes bonds of all maturities | Most maturity diversification |
| Barbell | A barbell (weight on both ends, thin bar in the middle) | Short-term and long-term bonds only; avoids intermediate maturities | Provides benefits of both short- and long-term bonds |
| Bullet | A bullseye | Bonds purchased over time that all mature at one target date | Targets a specific future date when the investor needs a large payout |
Bond ladders
The strategy spreads investments across many maturity dates.
Example: an investor wants to buy $10,000 of bonds with varying maturities. If each bond is purchased at its $1,000 par value, the portfolio could include:
| Ladder rungs (maturities) |
|---|
| 3-year bond |
| 6-year bond |
| 9-year bond |
| 12-year bond |
| 15-year bond |
| 18-year bond |
| 21-year bond |
| 24-year bond |
| 27-year bond |
| 30-year bond |
This creates “maturity diversification” by spacing maturities evenly (every three years in this example).
| Maturity | Risk exposure | Yield |
|---|---|---|
| Longer-term bonds | More exposed to interest rate and inflation risk | Typically higher yields |
| Shorter-term bonds | Less exposed | Lower yields |
“Revolving door” approach: When a bond matures, the proceeds are reinvested into a new long-term bond. Using the example above, after three years the 3-year bond matures, and the redemption proceeds could be used to buy a new 30-year bond. One rung matures, and a new rung is added at the long end.
Bond barbells
The investor buys short-term and long-term bonds, but avoids intermediate maturities.
Example: an investor wants to buy $10,000 of bonds with varying maturities, each purchased at $1,000 par value:
| Short end | Long end |
|---|---|
| 1-year bond | 26-year bond |
| 2-year bond | 27-year bond |
| 3-year bond | 28-year bond |
| 4-year bond | 29-year bond |
| 5-year bond | 30-year bond |
This strategy combines features of both ends of the maturity spectrum:
| Side | Characteristics | Reinvestment choice at maturity |
|---|---|---|
| Short-term bonds | More liquidity, typically less interest rate and inflation risk | If interest rates have risen, buy a long-term bond and lock in a higher yield for longer. If interest rates have declined, buy another short-term bond and wait for rates to rise |
| Long-term bonds | Typically higher yields, but carry more risk | In a barbell, that risk is balanced by the short-term side of the portfolio |
Bond bullets
Named after a bullseye. The idea is to target a specific future date when the investor needs a large payout.
Example: an investor is saving for a dream home over ten years. Each year, the investor buys $100,000 of bonds that will all mature at the 10-year mark:
| Year purchased | Bond bought |
|---|---|
| Year 1 | $100,000 of 10-year bonds |
| Year 2 | $100,000 of 9-year bonds |
| Year 3 | $100,000 of 8-year bonds |
| … and so on | … |
By the time the investor reaches the 10-year mark, they’ve purchased $1 million of bonds, all of which mature that year.
Key points
Strategic asset allocation
- Long-term asset allocation goal
- Rebalance portfolio periodically
Tactical asset allocation
- Deviating away from a long-term goal for a short-term opportunity
Passive portfolio management
- Investing in a pre-determined large portfolio (“the market”)
- Lower expenses than active management
Active portfolio management
- Investing in chosen securities within a large portfolio
- Higher expenses than passive management
Bond ladder strategy
- Investing in bonds with spread-out maturities
- Includes bonds of all maturities
- Provides most maturity diversification
Bond barbell strategy
- Investing in short and long-term bonds
- No intermediate-term bonds
- Provides benefits of short and long-term bonds
Bond bullet strategy
- Investing in bonds over time with a future target date
- All bonds mature at a target date
Sources
Primary/official references for the material on this page. Every link was fetched and returned HTTP 200 on 2026-08-15.
| # | Source | Publisher |
|---|---|---|
| 1 | Markowitz/Sharpe — portfolio theory and CAPM, the source work | Nobel Prize |
| 2 | Uniform Prudent Investor Act — portfolio-level fiduciary standard | Uniform Law Commission |
| 3 | Fama/Shiller — efficient markets and asset-price evidence | Nobel Prize |
| 4 | Achievable Series 65 — chapter 2.3.2 | Achievable (course text) |