Leading, Coincident & Lagging Indicators
⚠️ MONETARY vs FISCAL POLICY — orientation reminder
⚠️ The top trap in Unit 3. These indicators measure the economy rather than steer it, but keep the controllers straight:
| Policy | Who controls it | Tools |
|---|---|---|
| Monetary policy | Federal Reserve Board (the Fed); open market operations conducted by the FOMC | Discount rate, open market operations, reserve requirements, margin requirements (Reg T) — DORM |
| Fiscal policy | Congress and the President | Taxation and government spending |
Two items on this page are Fed-related but are indicators, not tools: the federal funds rate appears inside a leading indicator (the 10-year Treasury / fed funds spread), and CPI is a lagging indicator. Neither is a policy tool.
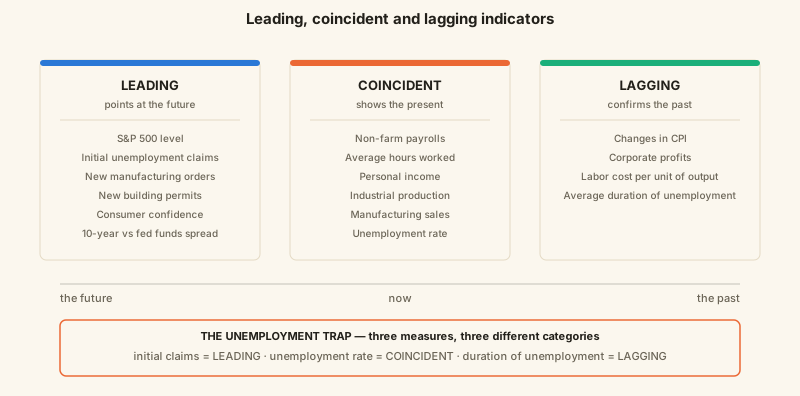
🔑 THE INDICATOR TABLE — LEADING / COINCIDENT / LAGGING
Misclassifying indicators is a classic trap. Reproduce this table from memory before the exam.
| LEADING — “Indicate future economic strength” | COINCIDENT — “Indicate current economic strength” | LAGGING — “Indicate past economic strength” |
|---|---|---|
| S&P 500 level | Number of employees on non-farm payrolls | Changes in CPI levels |
| Average weekly initial claims for unemployment | Average hours worked | Corporate profits |
| Index of new manufacturing orders | Personal income levels | Change in labor cost per unit of output |
| Number of new building permits | Industrial production levels | Average duration of unemployment |
| Consumer confidence index | Manufacturing sales | |
| Interest rate spread between 10-year Treasury notes and fed funds rate | Unemployment rate |
⚠️ THE UNEMPLOYMENT TRAP
Three different unemployment measures fall into three different categories:
| Unemployment measure | Category |
|---|---|
| Initial unemployment claims (average weekly initial claims) | LEADING |
| Unemployment rate | COINCIDENT |
| Average duration of unemployment | LAGGING |
Exam note: “Don’t worry too much about analyzing them - focus on which measure is leading, coincident, and lagging. Test writers often use similar topics (like different ways to measure unemployment) to check whether you understand these distinctions.”
Leading indicators
“Economists classify some economic indicators as leading because they tend to change before the overall economy changes. In other words, they help predict where the economy may be headed.”
The most common leading indicators include:
- S&P 500 level
- Average weekly initial claims for unemployment
- Index of new manufacturing orders
- Number of new building permits
- Consumer confidence index
- Interest rate spread between 10 year Treasury notes and fed funds rate
Detail on individual leading indicators
| Indicator | Why it leads |
|---|---|
| S&P 500 level | “the S&P 500 began accelerating downward toward the end of the summer of 2007. According to the US National Bureau of Economic Research, the Great Recession didn’t begin until December 2007 and didn’t become a major economic problem until mid-2008.” 🔑 “That’s why some economists describe the S&P 500 as roughly a six-month future (leading) economic predictor.” |
| Average weekly initial claims for unemployment | “measure how many people are newly losing their jobs. After someone becomes unemployed, they typically reduce spending on goods and services (at least until they’re re-employed). If many people file for unemployment at once, consumer spending can drop quickly, which can lead to GDP declines.” |
| Index of new manufacturing orders | “when businesses and households pull back on new purchases and new construction, overall economic activity often slows soon after” |
| Number of new building permits | Same logic as new orders — pullback on new construction precedes a slowdown |
| Consumer confidence index | “measures how optimistic people feel about the economy. Higher confidence tends to be associated with more consumer spending, while lower confidence often signals reduced spending.” |
| Interest rate spread (10-yr Treasury vs fed funds) | “used to anticipate economic declines. In particular, when Treasury note interest rates fall below the federal funds rate, it can signal an upcoming recession.” |
Exam note: “You don’t need to spend much time interpreting this spread in detail; test questions typically emphasize that it’s a leading indicator.”
Coincident indicators
“A coincident indicator helps describe the economy’s current strength.”
They include:
- Number of employees on non-farm payrolls
- Average hours worked
- Personal income levels
- Industrial production levels
- Manufacturing sales
- Unemployment rate
Exam note: “For exam purposes, the key point is what coincident indicators do: they help you gauge how strong the economy is right now.”
Lagging indicators
“A lagging indicator reflects the economy’s past performance.”
The most commonly cited lagging indicators include:
- Changes in CPI levels
- Corporate profits
- Change in labor cost per unit of output
- Average duration of unemployment
Economic market structures
“Economic market structures can significantly affect how prices are set and how firms compete. A structure might exist within one part of the economy (for example, pharmaceuticals) or across a broader market.”
Exam note: “You may see test questions on the basics of these four structures.”
The four structures:
- Perfect competition
- Monopolistic competition
- Oligopoly
- Monopoly
🔑 MARKET STRUCTURE COMPARISON TABLE
| Structure | Buyers | Sellers | Products | Barriers to entry | Price manipulation | Example |
|---|---|---|---|---|---|---|
| Perfect competition | Large number | Large number | “virtually identical products”; “Price is the primary demand factor” | Not stated | 🔑 Impossible — “No single participant is large enough to influence prices up or down.” | Farmer’s market — “multiple vendors sell similar goods (like fruits and vegetables), and price is a major factor in where customers choose to buy” |
| Monopolistic competition | Large number | Large number | “products are similar but not identical - each has unique characteristics”; “Consumers maintain preferences for certain goods” | Not stated | 🔑 Very difficult — “Because there are many competing options, it’s difficult for any one seller to drive overall market prices up or down.” | The chips aisle at a grocery store — “Doritos, Lays, Ruffles, Sun Chips, and many others” |
| Oligopoly | Large number | 🔑 Only a small number (often 3-5) | “Consumers have limited choices” | 🔑 Significant barrier to entry — “it’s expensive or difficult to enter the industry” | 🔑 Fairly easy — “With relatively few sellers, coordinating or influencing prices is easier than in markets with many competitors.” | Airlines — “American, Southwest, Delta, and United Airlines represent roughly 70% of the industry” |
| Monopoly | Large number | 🔑 One dominant seller | “Consumers only have one choice” | Not stated | 🔑 Very easy — “With no direct competition, price manipulation is easy” | Utility companies — “in many cities, electricity is provided by a single company or government-sponsored organization.” “Typically involve heavy government regulation” |
Trap: Perfect competition and monopolistic competition both have many buyers AND many sellers. The only difference is product identity — perfect = virtually identical products; monopolistic = similar but not identical, each with unique characteristics.
Trap: all four structures have a large number of buyers. The distinguishing variable is the number of sellers (many / many / 3-5 / 1) and product differentiation.
Structure-by-structure detail
Perfect competition
- “This structure has many buyers and sellers offering virtually identical products.”
- “No single participant is large enough to influence prices up or down.”
- Example: a farmer’s market.
Monopolistic competition
- “Like perfect competition, monopolistic competition has many buyers and sellers.”
- “The difference is that products are similar but not identical - each has unique characteristics.”
- “Consumers often have preferences for specific brands or features.”
Oligopoly
- “An oligopoly has many buyers but only a small number of sellers (often 3-5).”
- “The limited number of sellers is usually due to high barriers to entry.”
Monopoly
- “A monopoly has many buyers but one dominant seller.”
- “Although regulations aim to prevent monopolies, some still exist.”
- “which is why the utility sector is typically heavily regulated.”
Key points
Leading economic indicators
- Indicate future economic strength
- Included:
- S&P 500
- Average weekly initial claims for unemployment
- Index of new manufacturing orders
- Number of new building permits
- Consumer confidence index
- Interest rate spread between 10-year Treasury notes and fed funds rate
Coincident economic indicators
- Indicate current economic strength
- Included:
- Number of employees on non-farm payrolls
- Average hours worked
- Personal income levels
- Industrial production levels
- Manufacturing sales
- Unemployment rate
Lagging economic indicators
- Indicate past economic strength
- Included:
- Changes in CPI levels
- Corporate profits
- Change in labor cost per unit of output
- Average duration of unemployment
Perfect competition
- Large number of buyers and sellers
- Virtually identical goods/services
- Price is the primary demand factor
- Price manipulation is impossible
Monopolistic competition
- Large number of buyers and sellers
- Similar products, but unique characteristics
- Consumers maintain preferences for certain goods
- Price manipulation is very difficult
Oligopoly
- Large number of buyers, but only 3-5 sellers
- Consumers have limited choices
- Significant barrier to entry as a vendor
- Price manipulation is fairly easy
Monopoly
- Large number of buyers, only 1 seller
- Consumers only have one choice
- Price manipulation is very easy
- Typically involve heavy government regulation
Sources
Primary/official references for the material on this page. Every link was fetched and returned HTTP 200 on 2026-08-15.
| # | Source | Publisher |
|---|---|---|
| 1 | Leading Economic Index — the ten components | Conference Board |
| 2 | Employment situation — unemployment rate, payrolls | BLS |
| 3 | Producer Price Index | BLS |
| 4 | Business-cycle peaks and troughs — official US dating | NBER |
| 5 | Achievable Series 65 — chapter 3.1.5 | Achievable (course text) |