CAPM, MPT & Efficient Markets
Overview
Capital market theory refers to several approaches used to estimate the value of securities and to explain how supply and demand affect market prices.
🔑 Three ideas commonly grouped under capital market theory:
| # | Theory | One-line purpose |
|---|---|---|
| 1 | Capital asset pricing model (CAPM) | Estimates a security’s expected return using only factors tied to systematic risk |
| 2 | Modern portfolio theory (MPT) | Principles for building an efficient portfolio — highest return potential for the lowest risk exposure |
| 3 | Efficient market hypothesis (EMH) | Available market data and information about a security are reflected in its current market price |
Capital asset pricing model (CAPM)
The capital asset pricing model (CAPM) estimates a security’s expected return using only factors tied to systematic risk. CAPM uses the following formula:
🔑 The CAPM formula
ER = RF + (Beta x (MR - RF))
Where:
| Symbol | Meaning |
|---|---|
| ER | = expected return |
| RF | = risk-free return |
| MR | = market return |
Inputs — each is market-based
| Input | Description |
|---|---|
| Risk-free rate of return (RF) | Typically the return on the 3-month (or 91-day) Treasury bill. Treasury bills aren’t literally risk-free, but they’re generally viewed as having the lowest risk in the securities markets. That makes them a useful benchmark for “little-to-no systematic risk” |
| Beta | Measures how volatile a security or portfolio has been relative to the overall market |
| Market return (MR) | The return of the overall market (or a market benchmark), which CAPM uses as the reference point for market risk |
🔑 Worked CAPM question
An investor is evaluating a mid-cap growth fund. The expected return of the S&P 500 is 10%, the fund has a beta of 1.2 and a standard deviation of 18, and the 3-month T-bill rate is 3%. Using the capital asset pricing model, what is the fund’s expected return?
Answer = 11.4%
Step 1 — identify the inputs:
| Input | Value |
|---|---|
| Risk free rate | 3% |
| Beta | 1.2 |
| Market return | 10% |
Step 2 — plug them into the formula:
ER = RF + (Beta x (MR - RF))
ER = 3% + (1.2 x (10% - 3%))
ER = 3% + (1.2 x 7%)
ER = 3% + 8.4%
ER = 11.4%
The standard deviation is not needed for this calculation. (It is included in the question as a distractor.)
What CAPM leaves out
Notice what CAPM leaves out: it does not include security-specific risks. Non-systematic risks such as business risk, financial risk, and liquidity risk aren’t part of the model. In other words, CAPM estimates expected return based on market dynamics and systematic risk only.
CAPM and alpha
CAPM also connects directly to alpha.
| Concept | Role |
|---|---|
| CAPM | Gives you the expected return — produces the benchmark |
| Alpha | Compares performance by taking the security’s (or portfolio’s) actual return and subtracting this expected return — measures over- or underperformance relative to that benchmark |
Alpha = actual return − expected return (from CAPM)
Modern portfolio theory (MPT)
In 1952, economist Harry Markowitz published an essay on investing often viewed as the starting point of modern portfolio theory (MPT). The essay, titled Portfolio Selection, laid out principles for building an efficient portfolio.
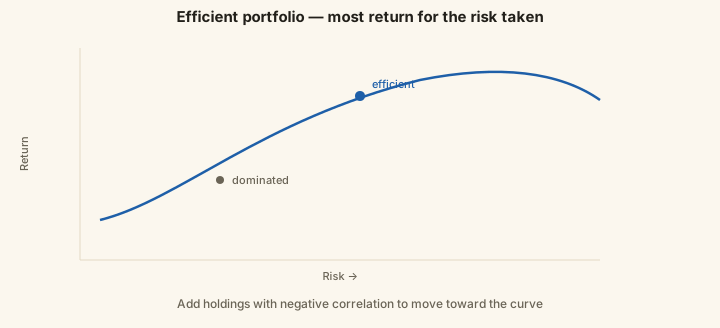
An efficient portfolio is designed to offer the highest return potential for the lowest risk exposure.
🔑 Markowitz’s assumptions about investors
| # | Assumption |
|---|---|
| 1 | Investors share the same assumptions |
| 2 | Investors can borrow at the risk-free rate |
| 3 | Investors seek the highest return, but are also risk averse |
The risk/return tradeoff and diversification
Given these assumptions, investors face a tradeoff: higher expected returns generally require taking more risk. MPT’s key tool for managing this tradeoff is diversification.
An investor might pursue higher returns by holding a volatile (risky) security. Even so, the overall portfolio’s risk can be reduced by combining investments whose returns don’t move together. For example, losses in a luxury cruise line stock during an economic downturn might be offset by gains in a defensive investment like a pharmaceutical company stock.
With proper diversification, the risk/return profile of any single security becomes less important than the risk/return profile of the portfolio as a whole.
That’s why a conservative, risk-averse investor might still allocate a small portion of assets to a high-risk security while keeping the overall portfolio suitable.
🔑 Correlation coefficient
To evaluate diversification benefits, investors use the correlation coefficient, which measures how similarly two securities or portfolios have moved historically.
Correlation ranges from -1 to +1.
| Correlation | Meaning | Example / note |
|---|---|---|
| +1 | The two investments have moved in the same direction and at the same rate | The S&P 500 index and an S&P index fund should maintain a correlation of 1. If the index is up 10% in a day, the fund tracking it should also be up about 10% |
| -1 | The two investments have moved at the same rate but in opposite directions | The S&P 500 index should maintain a -1 correlation with an inverse S&P 500 ETF. If the index is up 10% in a day, the inverse ETF should be down about 10%. ⚠️ Over longer periods, this correlation can decay because the holdings are effectively adjusted daily |
| 0 | There’s no relationship between the two | — |
| 0.5 | Roughly suggests they move together about half the time | — |
| -0.5 | Roughly suggests they move in opposite directions about half the time | — |
A common test point combines diversification and correlation: to further diversify, an investor should add securities with NEGATIVE correlations to the existing portfolio. On average, those positions tend to move differently from the rest of the portfolio, which can reduce losses when other holdings decline.
Diversification and asset allocation
Diversification isn’t only about adding more securities. Asset allocation matters too.
Strategic asset allocation builds on MPT by:
- Emphasizing a suitable long-term allocation
- Avoiding market timing
- Periodically rebalancing
Used correctly, it helps keep the portfolio’s overall risk/return profile aligned with the investor’s goals.
Efficient market hypothesis (EMH)
In today’s markets, information spreads quickly, and prices can adjust almost immediately when new data becomes available. That raises a practical question: if the market reacts so fast, does research still help you find mispriced securities?
Investors often review metrics before buying or selling, such as assets and liabilities on balance sheets, profitability on income statements, and market trends suggested by technical analysis. But even if those metrics look favorable, the market may have already responded to the same information. If so, the information is already “baked into” the current price.
That idea is the core of the efficient market hypothesis (EMH). EMH states that available market data and information about a security are reflected in its current market price. Information travels efficiently and is incorporated into prices quickly. If EMH holds, then research won’t reliably produce an investing edge: by the time you identify “good news,” the market price may already reflect it.
Investors who accept EMH tend to avoid selecting individual securities and instead focus on passive investing strategies. This approach aims to capture the returns of broad market segments rather than trying to outperform by security selection. It can also reduce costs by avoiding higher expense ratios often associated with actively managed funds.
There are three versions of EMH to be aware of: Strong, Semi-strong, and Weak.
🔑 The three forms of EMH compared
| Form | What is reflected in market prices | Inside information | Fundamental analysis | Technical analysis |
|---|---|---|---|---|
| Strong form | All public and private information | Useless | Useless | Useless |
| Semi-strong form | All public information | May predict future market movements | Useless | Useless |
| Weak form | Most public information | May predict future market movements | May predict future market movements | Useless |
Across all three forms, technical analysis is not believed to consistently predict market movements. Technical analysis assumes market patterns repeat. EMH conflicts with that assumption by treating price movements as random and unpredictable.
Strong EMH
Strong form EMH states all public and private information is reflected in the market prices of securities. Under this view, even non-public inside information* wouldn’t consistently help an investor earn excess returns.
There is an undeniable history of investors making significant returns or avoiding large losses when illegally using inside information. Strong form EMH doesn’t deny that history. Instead, it argues that even private information may not be as reliably useful as it appears, because unexpected events can overwhelm any advantage.
* ⚠️ Trading on material, non-public information, also known as inside information, is explicitly illegal. The specifics related to this concept are discussed in The USA & Federal Securities Acts.
Illustration: An executive at an oil company knows an upcoming earnings report will show profitability far above expectations. Expecting the stock price to rise when the report becomes public, the executive buys a large amount of company stock just before the release (illegally). A few days before the earnings report is released, an explosion occurs at one of the company’s rigs, causing a catastrophic environmental disaster. Cleanup costs and legal liabilities create billions of dollars in losses, and the stock price drops sharply despite the favorable earnings report.
In this scenario, even private insider information didn’t lead to a profit. Strong form EMH argues outcomes like this are more common than they may seem.
Semi-strong EMH
Semi-strong form EMH states all public information is reflected in the market prices of securities. This is a step down from strong form. It suggests that while public information is quickly priced in, non-public information CAN consistently predict future market movements. Under this view, scenarios like the oil company example can happen, but they’re considered infrequent.
Weak EMH
Weak form EMH states most public information is reflected in the market prices of securities. Like semi-strong EMH, weak form also argues private information can consistently predict future market movements. It adds another idea: complex fundamental analysis may provide insights into future supply and demand.
In the fundamental analysis chapter, we covered the basics of balance sheets and income statements. Many analysts spend years learning to interpret the details in these documents. For example, Nike’s 2021 annual report includes 109 pages of information about the company’s operations and finances.
If only a small portion of investors can accurately interpret complex financial statements, weak form EMH argues it’s reasonable that those investors may consistently predict the direction of market prices.
EMH summary
Proponents of EMH believe future market movements are random and unpredictable. How strongly they believe this depends on which form of EMH they accept:
Strong form EMH
- All information is reflected in current market prices
- Inside information, fundamental, and technical analysis are useless
Semi-strong form EMH
- All public information is reflected in current market prices
- Inside information may predict future market movements
- Fundamental and technical analysis is useless
Weak form EMH
- Most public information is reflected in the current market price
- Inside information and fundamental analysis may predict future market movements
- Technical analysis is useless
Random walk hypothesis
Some investors describe EMH’s conclusion using another label: the random walk hypothesis. The random walk hypothesis states market dynamics are consistently unpredictable, so attempts to evaluate an investment using available information are useless.
| Belief in EMH / random walk | Strategy tendency |
|---|---|
| More an investor believes in EMH or the random walk hypothesis | More likely to use passive strategies |
| Less an investor believes in EMH or the random walk hypothesis | More likely to use active investment strategies |
Key points
Capital asset pricing model (CAPM)
- Financial model for determining the expected return
- Only considers systematic risk
Expected return calculation
ER = RF + (Beta x (MR - RF))
Modern portfolio theory
- Modern protocols and best practices related to investing
- Goal: to attain the highest return potential with the smallest risk exposure
- Overall risk/return profile of portfolio most important
- Risk/return profile of individual securities not significant
- Diversification necessary to reduce risk
- Add negatively correlated securities to a portfolio to diversify
Strong form EMH
- All information is reflected in current market prices
- Inside information, fundamental, and technical analysis is useless
Semi-strong form EMH
- All public information is reflected in current market prices
- Inside information may predict future market movements
- Fundamental and technical analysis is useless
Weak form EMH
- Most public information is reflected in the current market price
- Inside information and fundamental analysis may predict future market movements
- Technical analysis is useless
Random walk hypothesis
- Market movements are unpredictable and random
Proponents for EMH / random walk
- Believe research on individual securities is useless
- Engage in passive investment strategies
Sources
Primary/official references for the material on this page. Every link was fetched and returned HTTP 200 on 2026-08-15.
| # | Source | Publisher |
|---|---|---|
| 1 | Markowitz/Sharpe — portfolio theory and CAPM, the source work | Nobel Prize |
| 2 | Fama/Shiller — efficient markets and asset-price evidence | Nobel Prize |
| 3 | e-Handbook of Statistical Methods — mean, median, dispersion | NIST/SEMATECH |
| 4 | Achievable Series 65 — chapter 2.4 | Achievable (course text) |