Sharpe, Total & Annualized Return
Overview
- Measuring a security’s performance is a core part of investing. You’ll want to be able to tell which holdings have performed best and worst based on their returns.
- Depending on the security, there may be more than one useful way to measure performance.
Common measures covered in this chapter:
- Risk-adjusted return
- Time-weighted return
- Dollar-weighted return
- Total return
- Holding period return
- Annualized rate of return
- Inflation-adjusted return
- After-tax return
- Rule of 72
- Benchmark comparisons
Risk-adjusted return (Sharpe ratio)
- Not all returns mean the same thing. A 10% return could be excellent or disappointing depending on how much risk you took to earn it.
- Example: a 10% return on a Treasury bill would be extraordinary given its low risk, while a 10% return on a high-risk hedge fund might be considered underperformance.
- That’s why some investors adjust returns for risk — to see how much return they’re getting per unit of risk.
- American economist William Sharpe developed a method for measuring risk-adjusted return in 1966. Now known as the Sharpe ratio, it measures a security’s or portfolio’s return while accounting for risk.
🔑 Sharpe ratio formula
Sharpe ratio = (Actual return − Risk-free rate) ÷ Standard deviation
Definitions
| Term | Definition | Example / detail |
|---|---|---|
| Risk-free rate of return | The 91-day (3-month) Treasury bill rate | Used as the subtraction in the numerator |
| Standard deviation | Measures how far a security’s returns deviate from its average return | Higher standard deviation means more volatility. Some investors describe it as a measure of “pure risk” (as opposed to beta, which measures volatility relative to the market) |
| Risk premium | Actual return − risk-free rate = risk premium — the numerator (top) of the fraction | If you accept the possibility of loss, you should expect compensation for taking that risk |
🔑 Interpreting the Sharpe ratio
| Sharpe ratio | Interpretation |
|---|---|
| Higher | The investment is more efficient (more return for the amount of risk taken) |
| Lower | The investment is less efficient (less return for the amount of risk taken) |
It’s unlikely you’ll be asked to calculate a Sharpe ratio on the exam, but you may see questions about what the components mean or what the ratio is used for.
& 3. Time-weighted vs. dollar-weighted return
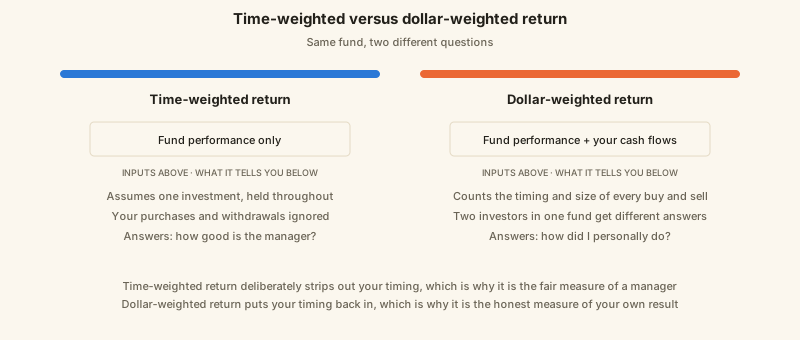
Investors in mutual funds commonly use two different return measures when evaluating performance.
🔑 Comparison table
| Item | Time-weighted return | Dollar-weighted return |
|---|---|---|
| What it measures | Performance over a specific time period assuming a buy and hold strategy | A mutual fund investor’s personal return |
| Based on | The fund’s performance only | (1) The fund’s performance, and (2) the investor’s own cash flows (timing and size of purchases and withdrawals) |
| Additional purchases / withdrawals | Not factored in | Factored in |
| Best used to analyze | Fund manager performance | An investor’s personal return |
| Primary application | Mutual funds | Mutual funds |
- A buy and hold strategy means you buy the investment and hold it for the entire period, with no additional purchases or sales during that time.
Time-weighted return in practice
- When you research a mutual fund, you’ll often see multiple time-weighted returns. On Morningstar, a fund’s “Trailing Returns” might include 1-day, 1-week, 1-month, 3 months, year-to-date (YTD), 1-year, 3-year, 5-year, 10-year, 15-year, and lifetime (since inception) returns.
🔑 These are time-weighted returns because they assume:
-
A single investment was made at the start of the period
-
The investment was held for the entire period
-
Dividends and capital gain distributions were reinvested
-
For instance, a 3-year return assumes the investment was made three years ago and then held, with no additional purchases or sales.
-
Time-weighted returns are especially useful for evaluating a mutual fund manager’s performance. Mutual funds are managed by teams of professionals, typically led by a fund manager. Some managers remain in place for long periods due to consistent performance — for example, Will Danoff has managed Fidelity’s Contrafund since 1990.
-
⚠️ Time-weighted return helps isolate the fund’s performance from an investor’s timing decisions. If an investor buys on a day the market rises sharply and sells on a day the market drops sharply, a loss may reflect poor timing rather than poor fund management.
Sidenote — Morningstar
| Item | Detail |
|---|---|
| What it is | A financial services company focused on investment research; well known for mutual fund research and its rating system |
| Rating scale | Assigns mutual funds 1–5 stars based on recent performance |
| 5-star funds | Highest risk-adjusted returns compared with similar funds (funds with similar investment goals) |
| 1-star funds | Lowest risk-adjusted returns |
Dollar-weighted return in practice
- Unlike time-weighted return, dollar-weighted return reflects what the investor actually experienced.
- ⚠️ If an investor buys more shares when the NAV is low or sells when the NAV is high, their dollar-weighted return may be higher than the time-weighted return over the same period (and vice versa).
Total return
- Total return measures an investment’s overall gain or loss as a percentage of its original cost. It captures the full rate of return from all sources.
🔑 The three ways an investor can earn a return (or lose money)
| Source | Detail |
|---|---|
| Dividends | Preferred stocks and some common stocks pay cash dividends |
| Interest | Debt securities pay interest |
| Capital gains and/or losses | Any security can produce a capital gain or loss |
| Capital gain/loss term | Definition |
|---|---|
| Capital gain | Occurs when market value rises above cost |
| Capital loss | Occurs when market value falls below cost |
| Realized | Occurs when the investment is sold |
| Unrealized | Occurs when the investment hasn’t been sold yet |
🔑 Total return formula
Total return = All gains and/or losses ÷ Original cost
Although calculations are relatively limited on this material, total return is a common calculation test takers encounter.
Worked example — total return
An investor purchases 100 shares of stock at $50 per share. The investor receives two quarterly dividends of $1 per share after holding the security for six months, then sells the security for $55 per share. What is the total return?
Answer = 14%
You can calculate total return using total dollars or on a per-share basis. Either works. For simplicity, use a per-share approach.
- Dividends received: $1 per quarter × 2 quarters = $2 per share
- Capital gain: $55 − $50 = $5 per share
- Total gain per share = $2 + $5 = $7
- Original cost per share = $50
Total return = ($2 dividend + $5 capital gain) ÷ $50 original cost
Total return = $7 overall return ÷ $50 original cost
Total return = 14%
Holding period return
- Holding period return is the rate of return earned over a specific holding period. In other words, it’s the total return for a defined time span.
- 🔑 In the example above, the investor held the stock for six months, and the holding period return over that six-month period is 14%.
Annualized return
- An annualized return expresses a total return as an annual rate.
🔑 Annualizing rules
| Holding period | Rule | Worked example |
|---|---|---|
| Less than one year | Multiply the total return by the number of those periods in a year | 14% earned in 6 months → 14% × 2 = 28% (two 6-month periods in a year) |
| Less than one year | Same rule | 14% earned in 4 months → 14% × 3 = 42% (three 4-month periods in a year) |
| Longer than one year | Divide the total return by the number of years | 14% over two years → 14% ÷ 2 = 7% |
Worked example: An investor purchases 100 shares of stock at $50 per share, receives two quarterly dividends of $1 per share after holding the security for six months, then sells the security for $55 per share. What is the annualized return?
The total return over six months was 14%. Since there are two six-month periods in a year:
14% × 2 = 28%
Inflation-adjusted return (real rate of return)
- The inflation-adjusted return, also called the real rate of return, is the total return minus the inflation rate.
- In the U.S., inflation is commonly measured using the consumer price index (CPI), which tracks price changes across a basket of goods and services.
- ⚠️ As covered in the fixed income unit, inflation is especially harmful to securities with fixed rates of return.
🔑 Inflation-adjusted return formula
Inflation-adjusted return = Total return − inflation rate (CPI)
Sidenote — Personal Consumption Expenditure (PCE) Price Index
- Technically, the Federal Reserve targets inflation based on the Personal Consumption Expenditure (PCE) Price Index, which is similar to CPI but differs in weighting and measurement.
Worked example — real rate of return on a bond
An investor buys a $1,000 par, 5% bond at 94 in the market. After holding the bond for exactly one year, the investor sells the bond at 97. Assuming CPI is reported at 4% for the year, what is the real rate of return?
Answer = 4.5%
First, find total return:
- Interest received: 5% × $1,000 par = $50
- Purchase price: 94 = $940
- Sale price: 97 = $970
- Capital gain: $970 − $940 = $30
*Both 94 and 97 are percentage of par quotes. 94% of par ($1,000) is $940, while 97% of par ($1,000) is $970.
Total return = ($50 interest + $30 capital gain) ÷ $940
Total return = $80 overall return ÷ $940
Total return = 8.5%
Now subtract inflation:
Real rate of return = Total return − inflation rate (CPI)
Real rate of return = 8.5% − 4.0%
Real rate of return = 4.5%
Note the denominator is the original cost ($940, the purchase price) — not par.
After-tax return
- After-tax return is the total return after accounting for taxes.
- ⚠️ This can get tricky because different types of returns may be taxed at different rates. As covered in the tax considerations chapter, dividends and capital gains don’t always receive the same tax treatment.
🔑 Tax rates referenced in this chapter
| Type of return | Tax rate | Notes |
|---|---|---|
| Qualified cash dividends | 15% (or 20%) | Only investors in the two highest tax brackets (35% and 37%) are subject to the 20% dividend tax rate |
| Short-term capital gains | The investor’s ordinary income tax bracket | A holding period of one year or less is short-term |
| REIT dividends | Investor’s income tax bracket | ⚠️ Nearly all income paid from equity securities is qualified (15% or 20%). The one exception: real estate investment trusts (REITs) pay non-qualified dividends |
🔑 After-tax return formula
After-tax return = After-tax returns ÷ Original cost
To convert each return to an after-tax amount:
After-tax amount = Return × (100% − tax rate)
Worked example — after-tax return
An investor in the 24% tax bracket purchases 100 shares of stock at $80 per share. Over a year, they receive $2 quarterly dividends (per share). The investor sells the stock at $90 per share exactly one year after it was purchased. What is the after-tax return?
Answer = 18%
First, identify the two sources of return:
- Cash dividends
- A short-term capital gain (a holding period of one year or less is short-term)
Tax treatment: qualified cash dividends for this investor are taxed at 15% (only the 35% and 37% brackets pay the 20% rate). Short-term capital gains are taxed at the investor’s ordinary income bracket, which is 24%.
Compute on a per-share basis:
- Dividends: $2 quarterly dividend × 4 payments = $8 per share
- Capital gain: $90 − $80 = $10 per share
Applicable tax rates:
- $8 in dividends, taxed at 15%
- $10 in capital gains, taxed at 24%
Convert each to after-tax:
- $8 dividends × 85% (100% − 15%) = $6.80 after-tax
- $10 capital gain × 76% (100% − 24%) = $7.60 after-tax
Now compute after-tax return:
After-tax return = ($6.80 dividends + $7.60 capital gain) ÷ $80.00 original cost
After-tax return = $14.40 overall after-tax return ÷ $80.00 original cost
After-tax return = 18%
Rule of 72
- In the late 15th century, Italian mathematician Luca Pacioli introduced a simple way to estimate how long it takes to earn a 100% return on an investment. This shortcut is called the Rule of 72.
- The Rule of 72 isn’t perfectly precise (more complex math is needed for exact results), but it’s a quick way to estimate how fast an investment can double.
- *Making a 100% return on an investment is the same as doubling the investment. Example: an investor makes a $10,000 investment. A 100% return would be an additional $10,000, increasing the investment’s value to $20,000 (2x the starting amount).
🔑 The two Rule of 72 formulas
Time needed to 2x money = 72 ÷ Annual rate of return
Annual return to 2x money = 72 ÷ Time period (in years)
When using this calculation, do not enter the rate of return on a typical decimal basis. For example, if the rate of return is 7%, you enter ‘7’ into the denominator, not ‘0.07.’
Worked example 1 — time needed to double
An investor believes they can attain an annual rate of return of 9% on an investment of $100,000. Assuming their goal is to grow the funds to $200,000 for a down payment on a home, how long will it take to reach the goal?
Answer = 8 years
Time needed to 2x money = 72 ÷ 9
Time needed to 2x money = 8 years
Worked example 2 — return needed to double
A customer has $50,000 to invest for their daughter’s college experience. Their goal is to grow the funds to $100,000 before the child turns 18. Assuming the daughter is currently age 12, what annualized rate of return must they attain?
Answer = 12%
The daughter is 12 now, and the funds must double by age 18. That’s 6 years.
Annual return to 2x money = 72 ÷ 6 years
Annual return to 2x money = 12%
Worked example 3 — multiple doublings ⚠️
An investor recently received a $50,000 bonus from their employer and plans to invest the funds into the market. Their goal is to reach $200,000 within 8 years. What annualized rate of return is required?
Answer = 18%
The investor wants to double the money twice in 8 years ($50k → $100k → $200k). That’s equivalent to doubling every 4 years.
Annual return to 2x money = 72 ÷ 4 years
Annual return to 2x money = 18%
Rule of 72 questions can involve multiple doublings. Divide the total time period by the number of doublings first, then apply the formula.
Benchmark comparisons
- After you calculate a portfolio’s or security’s return, it’s often compared to a relevant benchmark index.
- Example: large-company stocks are commonly compared to the S&P 500 index. If a stock is up 15% for the year while the S&P 500 is up 10%, the stock is said to have outperformed the market by 5%.
- An index tracks the market prices of a pre-determined group of investments. For example, the S&P 500 tracks 500 of the largest U.S.-based publicly traded companies, including Apple, JP Morgan Chase, and Amazon.
- In general, an index reflects the average change in market prices for a basket of securities. However, indexes can weight holdings differently. For example, Amazon’s price changes affect the S&P 500 more than Alaska Airlines stock because Amazon’s market capitalization is much larger. The larger the company, the more influence it typically has in a cap-weighted index.
🔑 The two weighting methods
| Weighting method | How it works |
|---|---|
| Price-weighted | Weights more heavily the stocks with higher share prices |
| Cap-weighted | Weights more heavily the stocks with higher market capitalizations |
🔑 Indexes to know for the exam
| Index | What it tracks | Weighting |
|---|---|---|
| S&P 500 | 500 large-cap stocks | Cap-weighted |
| S&P 100 | 100 large-cap stocks (a subset of the S&P 500) | Cap-weighted |
| S&P 400 | 400 mid-cap stocks | Cap-weighted |
| Dow Jones Composite | 65 prominent stocks; composite of DJIA, DJTA, and DJUA | Price-weighted |
| Dow Jones Industrial Average (DJIA) | 30 prominent stocks (various industries) | Price-weighted |
| Dow Jones Transportation Average (DJTA) | 20 prominent transportation stocks | Price-weighted |
| Dow Jones Utilities Average (DJUA) | 15 prominent utilities stocks | Price-weighted |
| Russell 2000 | 2,000 small-cap stocks | Cap-weighted |
| NASDAQ Composite | All stocks on the NASDAQ exchange | Cap-weighted |
| NASDAQ 100 | 100 largest stocks on the NASDAQ exchange | Cap-weighted |
| Wilshire 5000 | All actively traded stocks in the US; considered the broadest domestic index | Cap-weighted |
| EAFE index | Stocks in Europe, Australasia and Far East | Cap-weighted |
Only the Dow Jones indexes (Composite, DJIA, DJTA, DJUA) are price-weighted. Every other index listed is cap-weighted. 65 = 30 + 20 + 15.
Key points
Risk-adjusted return
- Calculates return while factoring out risk
- Also known as the Sharpe ratio
Sharpe ratio formula
- Sharpe ratio = (Actual return − Risk free rate) ÷ Standard deviation
Time-weighted return
- Utilized primarily for mutual funds
- Assumes “buy and hold” over a specific time period
- Does not factor in additional purchases and/or withdrawals
- Best to analyze fund manager performance
Dollar-weighted return
- Utilized primarily for mutual funds
- Investor-specific return over a specific time period
- Factors in additional purchases and/or withdrawals
- Best to analyze an investor’s personal return
Total return
- Measures overall rate of return on a security or portfolio
Total return formula
- Total return = All gains and/or losses ÷ Original cost
Holding period return
- Total return of a specified time period
Annualized return
- Total return on an annual basis
Inflation-adjusted return
- Also known as the real rate of return
- Total return with inflation factored out
Inflation-adjusted return formula
- IAR = Total return − inflation rate
After-tax return
- Total return with taxes factored out
Rule of 72
- Determines the amount of time needed to 2x investment
- Time needed = 72 ÷ Annual return
- Determines annual return needed to 2x investment
- Return required = 72 ÷ Time period
S&P 500 index
- Tracks 500 large-cap stocks
- Cap-weighted index
S&P 100
- Tracks 100 large-cap stocks (a subset of the S&P 500)
- Cap-weighted index
S&P 400
- Tracks 400 mid-cap stocks
- Cap-weighted index
Dow Jones Composite
- Tracks 65 prominent stocks
- Composite of DJIA, DJTA, and DJUA
- Price-weighted index
Dow Jones Industrial Average (DJIA)
- Tracks 30 prominent stocks (various industries)
- Price-weighted index
Dow Jones Transportation Average (DJTA)
- Tracks 20 prominent transportation stocks
- Price-weighted index
Dow Jones Utilities Average (DJUA)
- Tracks 15 prominent utilities stocks
- Price-weighted index
Russell 2000
- Tracks 2,000 small-cap stocks
- Cap-weighted index
NASDAQ Composite
- Tracks all stocks on the NASDAQ exchange
- Cap-weighted index
NASDAQ 100
- Tracks 100 largest stocks on the NASDAQ exchange
- Cap-weighted index
Wilshire 5000
- Tracks all actively traded stocks in the US
- Considered the broadest index
- Cap-weighted index
EAFE index
- Tracks stocks in Europe, Australasia and Far East
- Cap-weighted index
Sources
Primary/official references for the material on this page. Every link was fetched and returned HTTP 200 on 2026-08-15.
| # | Source | Publisher |
|---|---|---|
| 1 | Markowitz/Sharpe — portfolio theory and CAPM, the source work | Nobel Prize |
| 2 | e-Handbook of Statistical Methods — mean, median, dispersion | NIST/SEMATECH |
| 3 | Compound interest / time value of money calculator | SEC / Investor.gov |
| 4 | Achievable Series 65 — chapter 2.10 | Achievable (course text) |